A developer has written a multi-threaded application that is running on a fleet of Amazon EC2 instances.
The operations team has requested a graphical method to monitor the number of running threads over time.
What is the MOST efficient way to fulfill this request?
A. Periodically send the thread count to AWS X-Ray segments, then generate a service graph on demand.
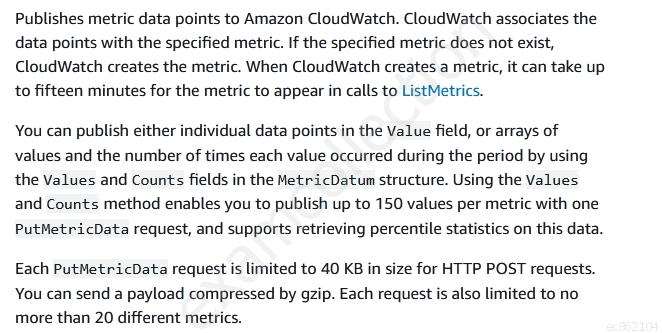
B. Create a custom Amazon CloudWatch metric and periodically perform a PutMetricData call with the current thread count.
C. Periodically log thread count data to Amazon S3. Use Amazon Kinesis to process the data into a graph.
D. Periodically write the current thread count to a table using Amazon DynamoDB and use Amazon CloudFront to create a graph.
