An analyst needs to provide a chart to identify the composition between the categories of the survey response data set:
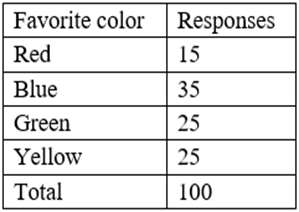
Which of the following charts would be BEST to use?
A. Histogram
B. Pie
C. Line
D. Scatter pot
E. Waterfall
Which of the following charts would be BEST to use?
A. Histogram
B. Pie
C. Line
D. Scatter pot
E. Waterfall