Which of the following is an example of a discrete variable? A. The temperature of a hot tub B. The height of a horse C. The time to complete a task D. The number of people in an office
A data analyst needs to create a weekly recurring report on sales performance and distribute it to all sales managers. Which of the following would be the BEST method to automate and ensure successful delivery for this task? A. Use scheduled report delivery. B. Implement subscription access delivery. C. Print out a copy. D. Upload the report to the server.
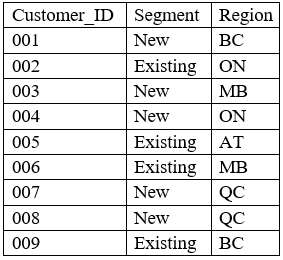
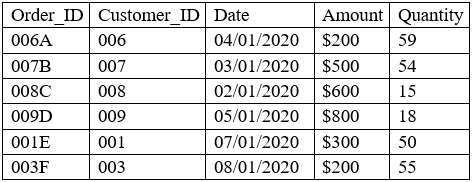
A data analyst has been asked to merge the tables below, first performing an INNER JOIN and then a LEFT JOIN:
Customer Table
In-store Transactions
Which of the following describes the number of rows of data that can be expected after performing both joins in the order stated, considering the customer table as the main table? A. INNER: 6 rows; LEFT: 9 rows B. INNER: 9 rows; LEFT: 6 rows C. INNER: 9 rows; LEFT: 15 rows D. INNER: 15 rows; LEFT: 9 rows
A data analyst has been asked to create a sales report that calculates the rolling 12-month average for sales. If the report will be published on November 1, 2020, which of the following months shouts the report cover? A. October 1, 2019 to October 31, 2020 B. October 31, 2020 to November 1, 2021 C. November 1, 2019 to October 31, 2020 D. October 31, 2019 to October 31, 2020
An analyst needs to conduct a quick analysis. Which of the following is the FIRST step the analyst should perform with the data? A. Conduct an exploratory analysis and use descriptive statistics. B. Conduct a trend analysis and use a scatter chart. C. Conduct a link analysis and illustrate the connection points. D. Conduct an initial analysis and use a Pareto chart.
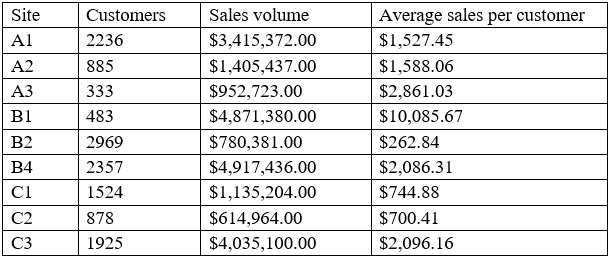
A data analyst is designing a dashboard that will provide a story of sales and determine which site is providing the highest sales volume per customer. The analyst must choose an appropriate chart to include in the dashboard. The following data is available:
Which of the following types of charts should be considered? A. Include a line chart using the site and average sales per customer. B. Include a pie chart using the site and sales to average sales per customer. C. Include a scatter chart using sales volume and average sales per customer. D. Include a column chart using the site and sales to average sales per customer.
The current date is July 14, 2020. A data analyst has been asked to create a report that shows the company's year-over-year Q2 2020 sales. Which of the following reports should the analyst compare? A. Q2 2020 and Q4 2019 B. YTD 2020 and YTD 2019 C. Q2 2020 and Q2 2019 D. Q2 2020 and Q2 2021
A commissions analyst has just completed second-quarter payout statements. The analyst created a dashboard to distribute the statements as quickly as possible. Which of the following will ensure only designated employees can view this information? A. Publish it on the company intranet. B. Provide individual links to recipients. C. Grant subscription access. D. Print individual dashboards.