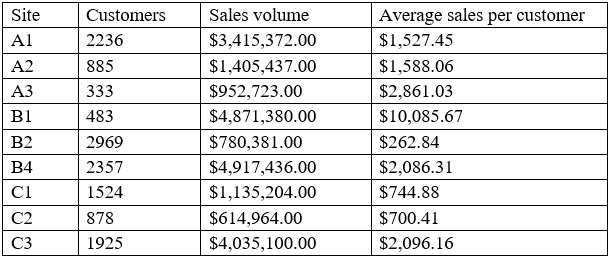
A data analyst is designing a dashboard that will provide a story of sales and determine which site is providing the highest sales volume per customer. The analyst must choose an appropriate chart to include in the dashboard. The following data is available:

Which of the following types of charts should be considered?
A. Include a line chart using the site and average sales per customer.
B. Include a pie chart using the site and sales to average sales per customer.
C. Include a scatter chart using sales volume and average sales per customer.
D. Include a column chart using the site and sales to average sales per customer.