CompTIA Data+ DA0-001 – Question69

Randy scored 76 on a math test, Katie scored 86 on a science test, Ralph scored 80 on a history test, and Jean scored 80 on an English test. The table below contains the mean and standard deviation of the scores for each of the courses:

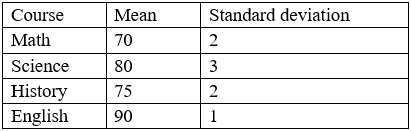
Using this information, which of the following students had the BEST score?

A.
Randy
B. Katie
C. Ralph
D. Jean

Correct Answer: B

CompTIA Data+ DA0-001 – Question68

A database consists of one fact table that is composed of multiple dimensions. Depending on the dimension, each one can be represented by a denormalized table or multiple normalized tables. This structure is an example of a:

A.
transactional schema.
B. star schema.
C. non-relational schema.
D. snowflake schema.

Correct Answer: A

CompTIA Data+ DA0-001 – Question65

A data analyst must separate the column shown below into multiple columns for each component of the name:

Which of the following data manipulation techniques should the analyst perform?

A.
Imputing
B. Transposing
C. Parsing
D. Concatenating

Correct Answer: C

CompTIA Data+ DA0-001 – Question63

Different people manually type a series of handwritten surveys into an online database. Which of the following issues will MOST likely arise with this data? (Choose two.)

A.
Data accuracy
B. Data constraints
C. Data attribute limitations
D. Data bias
E. Data consistency
F. Data manipulation

Correct Answer: AF

CompTIA Data+ DA0-001 – Question62

The process of performing initial investigations on data to spot outliers, discover patterns, and test assumptions with statistical insight and graphical visualization is called:

A.
a t-test.
B. a performance analysis.
C. an exploratory data analysis.
D. a link analysis.

Correct Answer: C

CompTIA Data+ DA0-001 – Question61

A cereal manufacturer wants to determine whether the sugar content of its cereal has increased over the years.
Which of the following is the appropriate descriptive statistic to use?

A.
Frequency
B. Percent change
C. Variance
D. Mean

Correct Answer: D

CompTIA Data+ DA0-001 – Question60

An analyst is designing a dashboard to determine which site has the highest percentage of new customers. The analyst must choose an appropriate chart to include in the dashboard. The following data is available:

Which of the following types of charts should be considered to BEST display the data?

A.
Include a bar chart using the site and the percentage of new customers data.
B. Include a line chart using the site and the percentage of new customers data.
C. Include a pie chat using the site and percentage of new customers data.
D. Include a scatter chart using the site and the percent of new customers data.

Correct Answer: A